AcruxCore vs Arize Phoenix: OTel tracing vs a gateway
Arize Phoenix is a tracing and evaluation tool built on OpenTelemetry and OpenInference. Its
source is public on GitHub under the Elastic License 2.0 (checked on 2 November 2026). It records what your own client sends to a model provider. AcruxCore puts the
call itself through a gateway. To see what that difference changes, we rebuilt one support
prompt, vip-support-triage, on a self-hosted Phoenix and on AcruxCore. The prompt changes its
tone for VIP customers and lists their open tickets. On each side we took it from the
Playground through a trace, a dataset, an experiment and an SDK script.
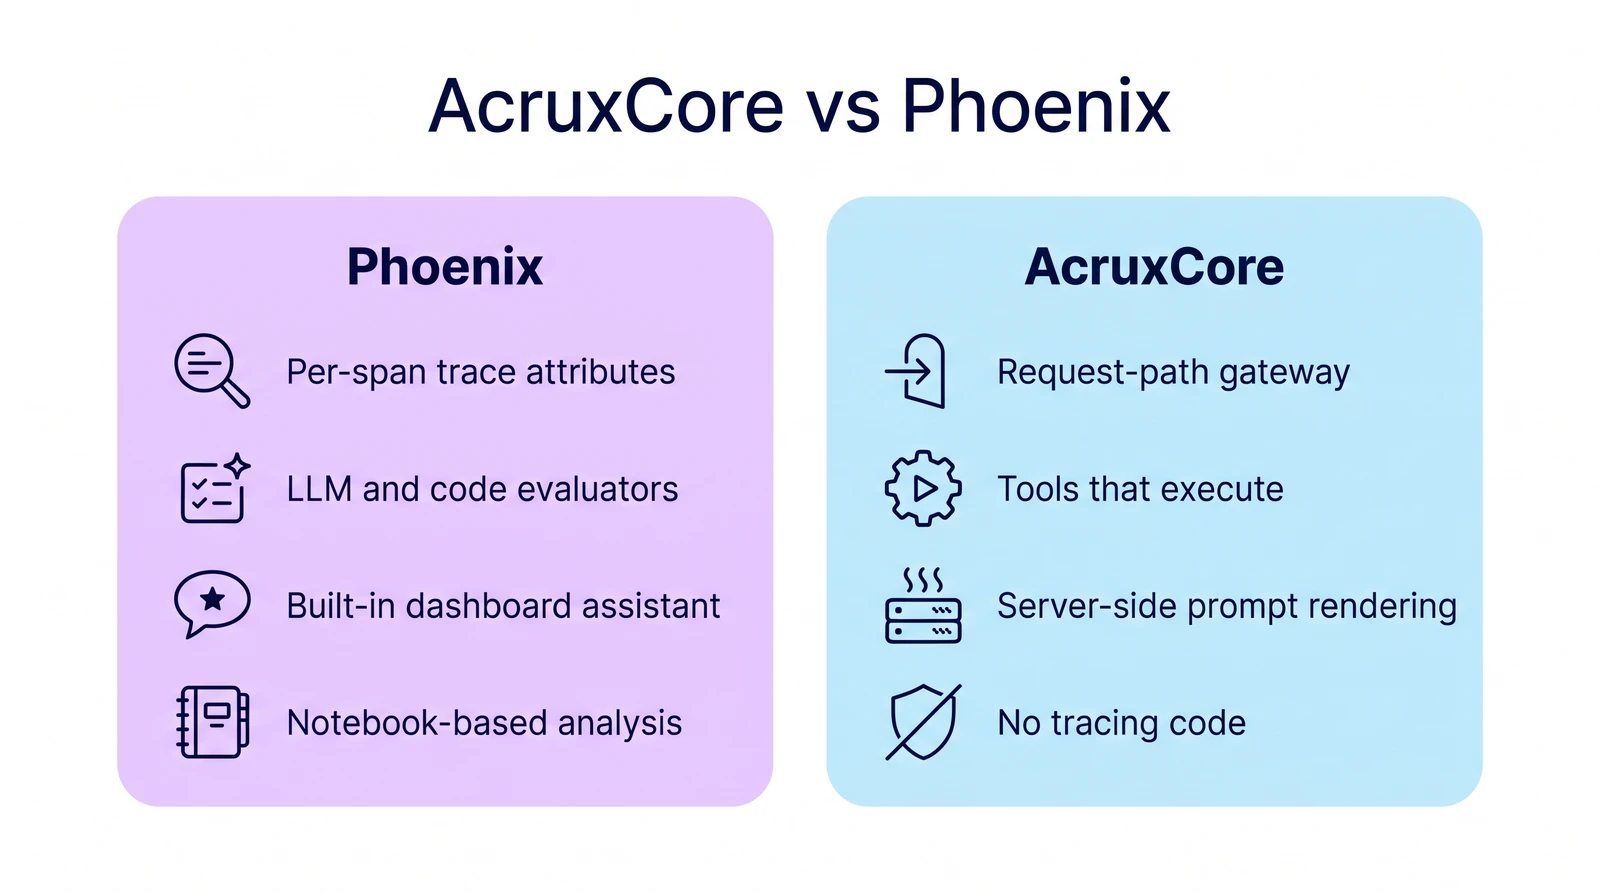
The short answer: Phoenix shows more detail per span, has a built-in assistant, and suits work
that happens in a notebook. AcruxCore puts a gateway in the request path, runs the tools in its
catalog, and renders stored prompts on the server. Phoenix renders a pulled prompt in your own
process with prompt.format().
AcruxCore is our product. The scripts for both legs are linked in the sections below.
How we tested
- Phoenix: self-hosted at
http://localhost:6006with authentication off, which is the default ("By default Phoenix deploys with authentication disabled", Phoenix docs, checked on 2 November 2026). Phoenix version not recorded. - Provider: OpenRouter, set up in Phoenix as a Custom AI Provider. Both sides sent the same
prompt and customer message to
openai/gpt-4o-mini. - Dates: hands-on steps and screenshots on 7 August 2026. Latency from three benchmark runs committed on 7 September 2026.
- AcruxCore in the benchmark: a local gateway on the loopback interface
(
http://localhost:3001), so its leg adds no internet hop of its own. Hardware not recorded.
At a glance
| Aspect | Phoenix | AcruxCore |
|---|---|---|
| Tracing depth | One span per call in this run, with OTel semantic-convention attributes and Info, Attributes and Events tabs | One automatic span per gateway call; trees through SDK steps or OTel framework instrumentors |
| Prompt templating | Mustache, where {{#section}} serves as both if and for; F-String; or no templating | Nunjucks {% if %} / {% for %} logic |
| Prompt rendering in code | Pull by name, version or tag, then prompt.format() in your process | prompts.render() on the server, or a prompt reference in the gateway call |
| Playground | Cost, tokens, latency shown inline | Cost, cache, latency shown inline |
| Request-path gateway | None. Playground calls go through a GraphQL mutation, SDK calls go direct | Built in: routing, caching, budgets |
| Tool catalog | Tool JSON saved with each prompt version, no catalog page | Versioned catalog, executed calls, analytics |
| Dataset creation | From a trace span, or manually | Span-level trace feedback, manual entry, API, or a CSV/JSON file |
| Time-to-first-trace | SDK setup (register + instrument) before anything lands | No code, first gateway call |
| MCP server | A hosted endpoint built into Phoenix that exposes its REST operations, read-only SQL and GraphQL, plus a local package now in maintenance mode | Hosted or local: commit and promote prompts, run a stored prompt through the gateway, run experiments, use the tool catalog |
- Pick Phoenix if you want OTel-native tracing and evals added to a client you already own, your work happens in a notebook, and three user roles without teams are enough.
- Pick AcruxCore if you want the provider call itself to go through a gateway, with tools that run, datasets built from feedback, server-side prompt rendering and a team model. AcruxCore also accepts your own OTel-instrumented traces on its OTLP endpoint.
License, pricing, team structure, security, and community stats: see AcruxCore vs Phoenix on the compare page.
Tracing & observability
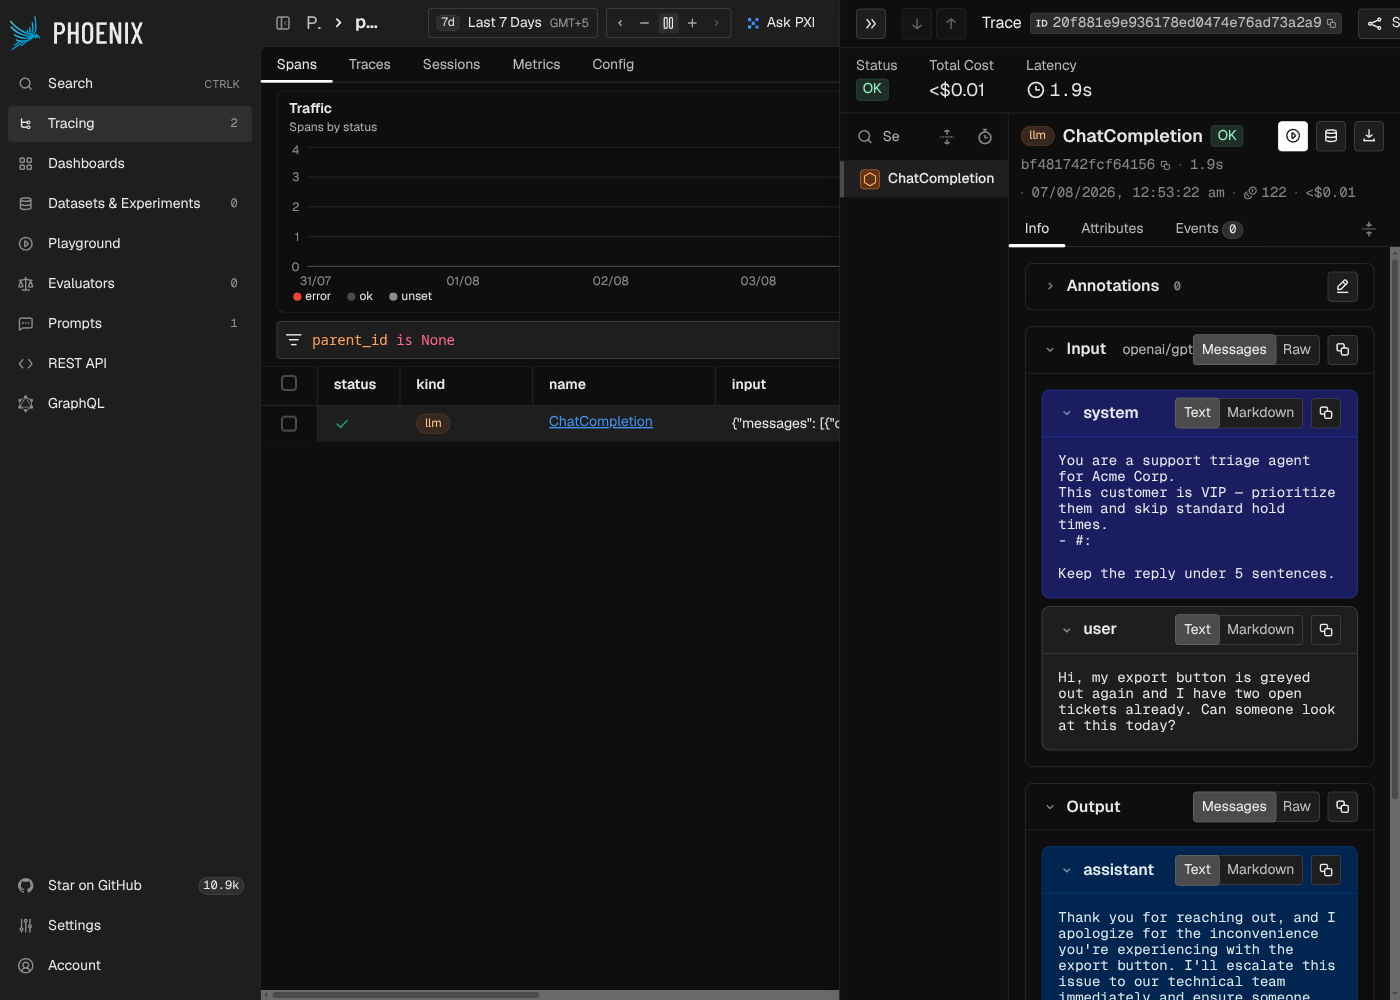
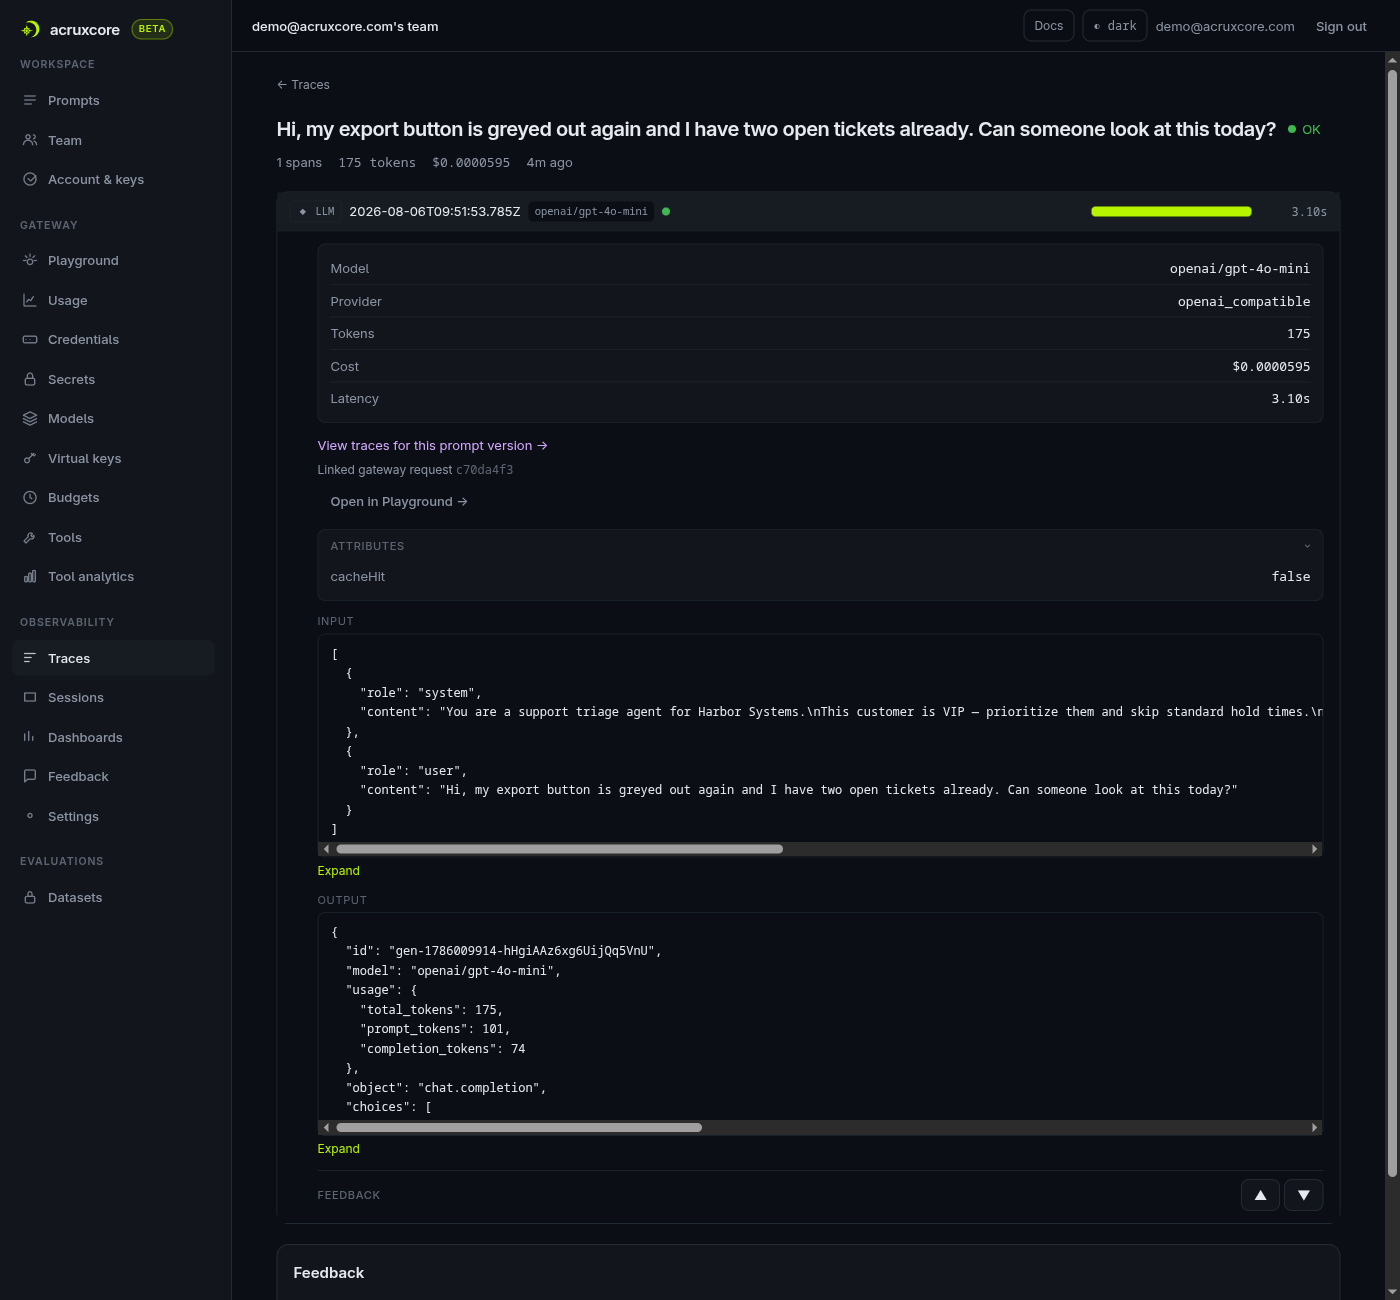
The same call produced a richer trace view on Phoenix. Its Info, Attributes and Events tabs, per-span cost and token counts, and OTel semantic-convention attributes show more than AcruxCore shows for the same span.
Show screenshots: trace detail on both platforms
| Feature | Phoenix | AcruxCore |
|---|---|---|
| Trace shape | One span per call in this run, with attribute and event tabs | One span per gateway call; SDK steps or OTel instrumentors add a tree around it |
| How it's produced | Client-side OTel instrumentation (Playground calls go through Phoenix's own GraphQL backend) | Automatic, as part of the gateway call |
| Links back to prompt version | Not surfaced in this run | A "View traces for this prompt version" link |
Prompt authoring & versioning
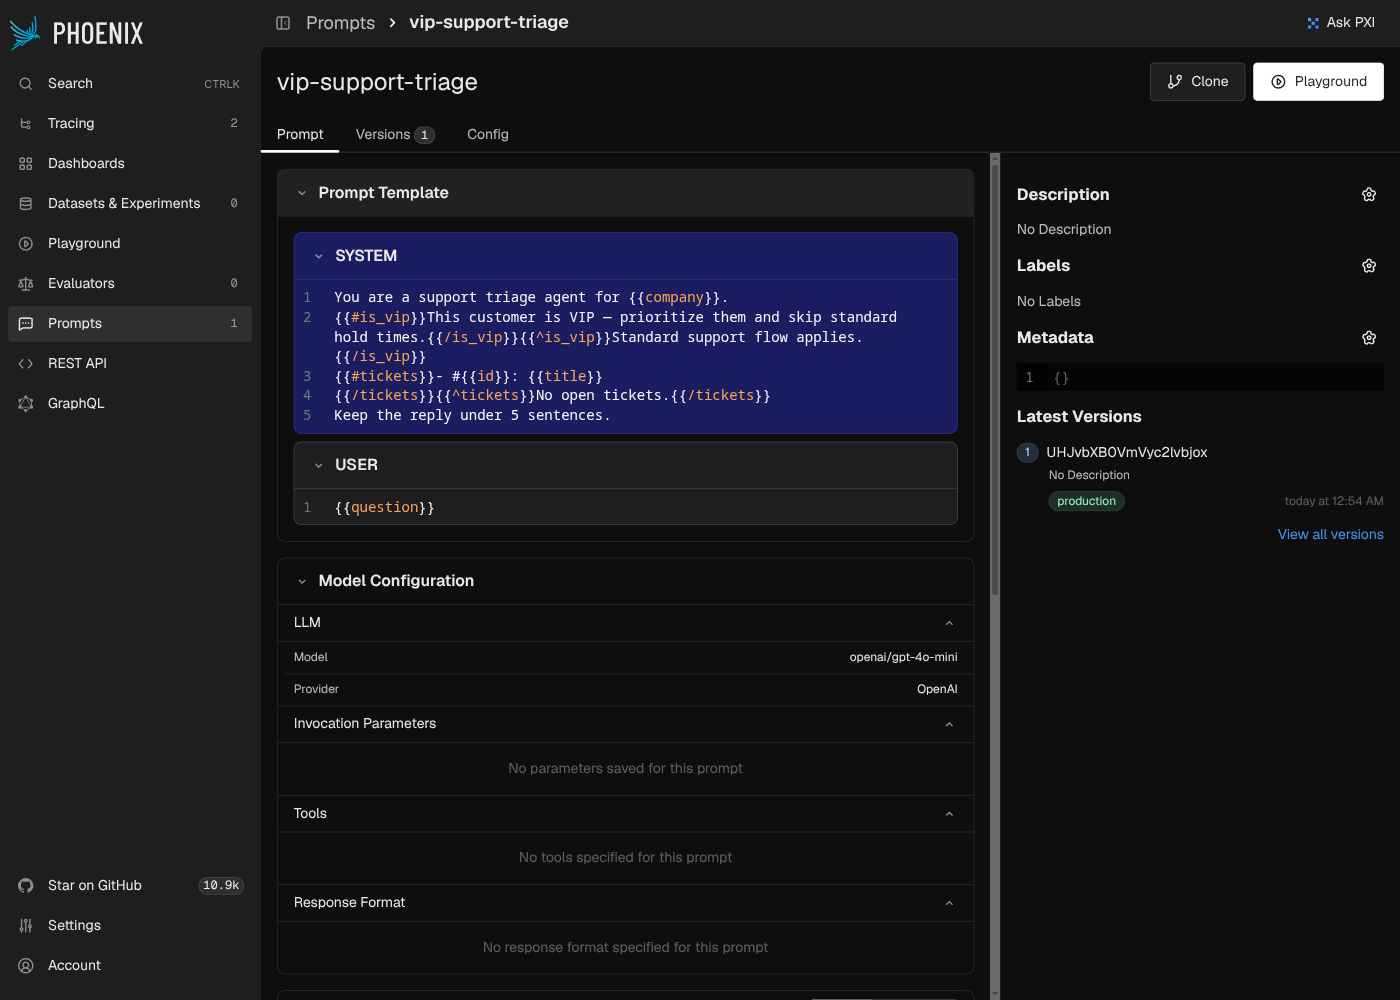
Phoenix's Prompts feature lives inside the Playground. There is no standalone "create prompt"
form: you build the prompt live and save it from there. Its templating engine is Mustache,
selectable alongside F-String and no templating. Mustache has no separate if-statement:
{{#is_vip}}...{{/is_vip}} is the same section syntax used to loop over tickets, so one
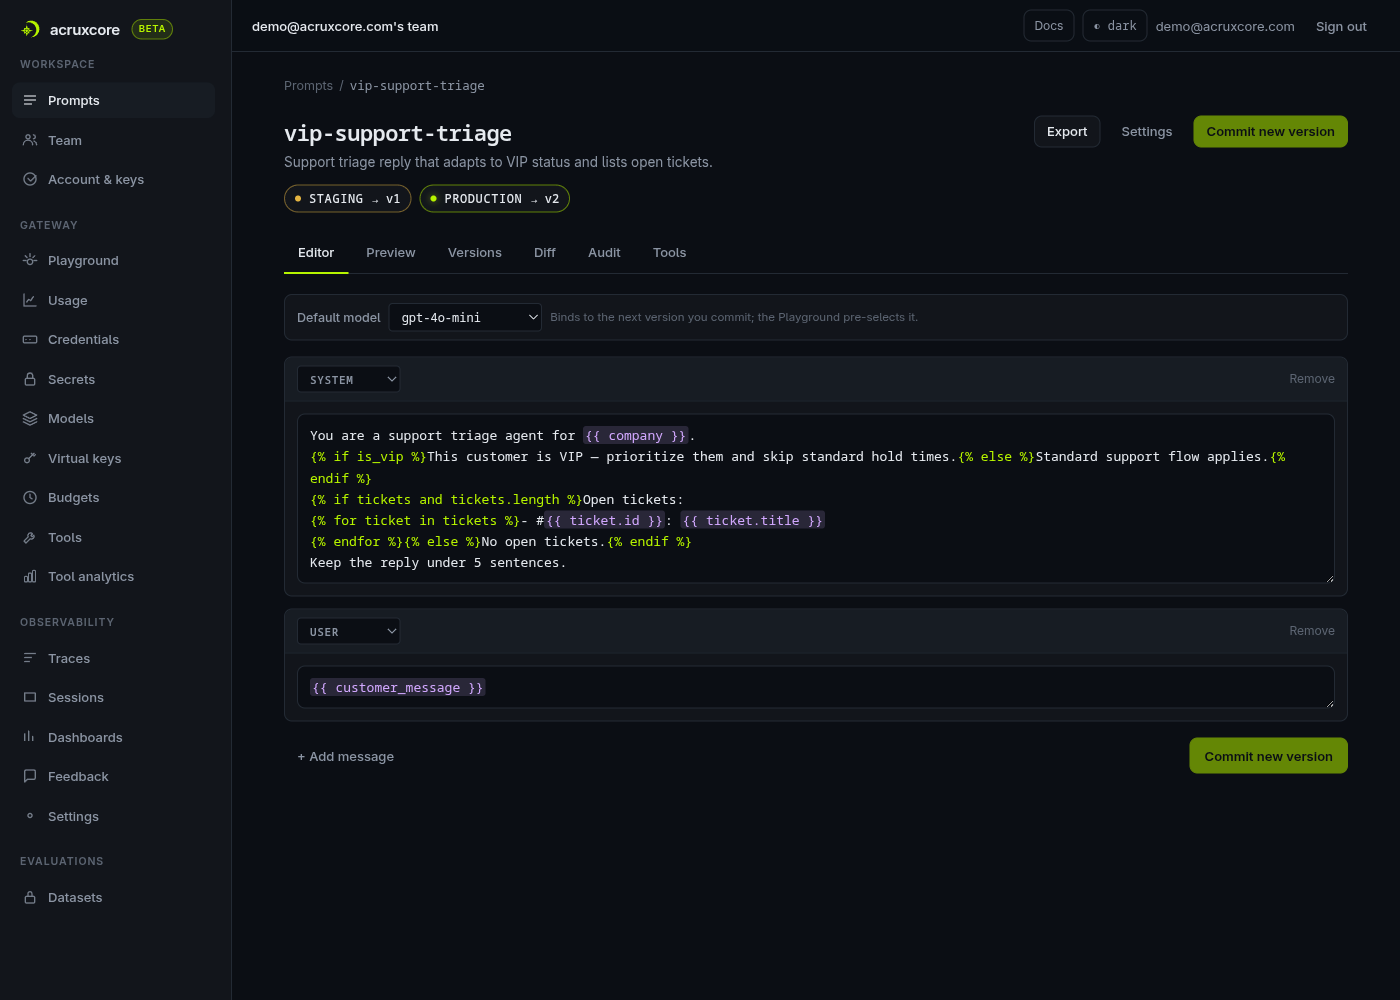
construct handles a truthy scalar and an array. In Nunjucks, {% if %} and {% for %} are two
different tags.
Show screenshots: prompt editor, detail, and diff view
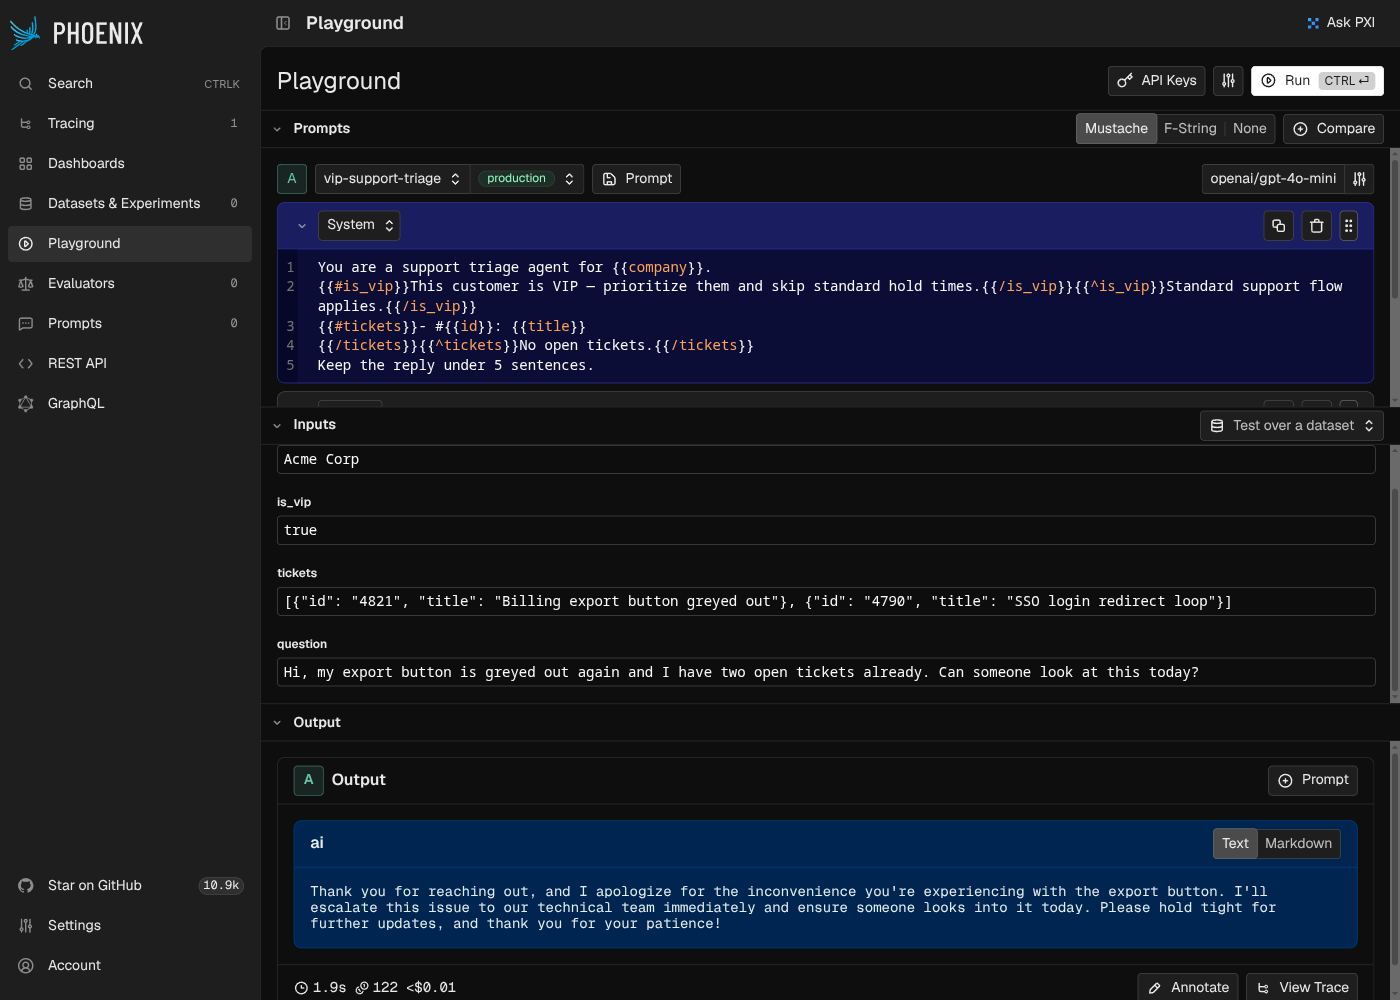
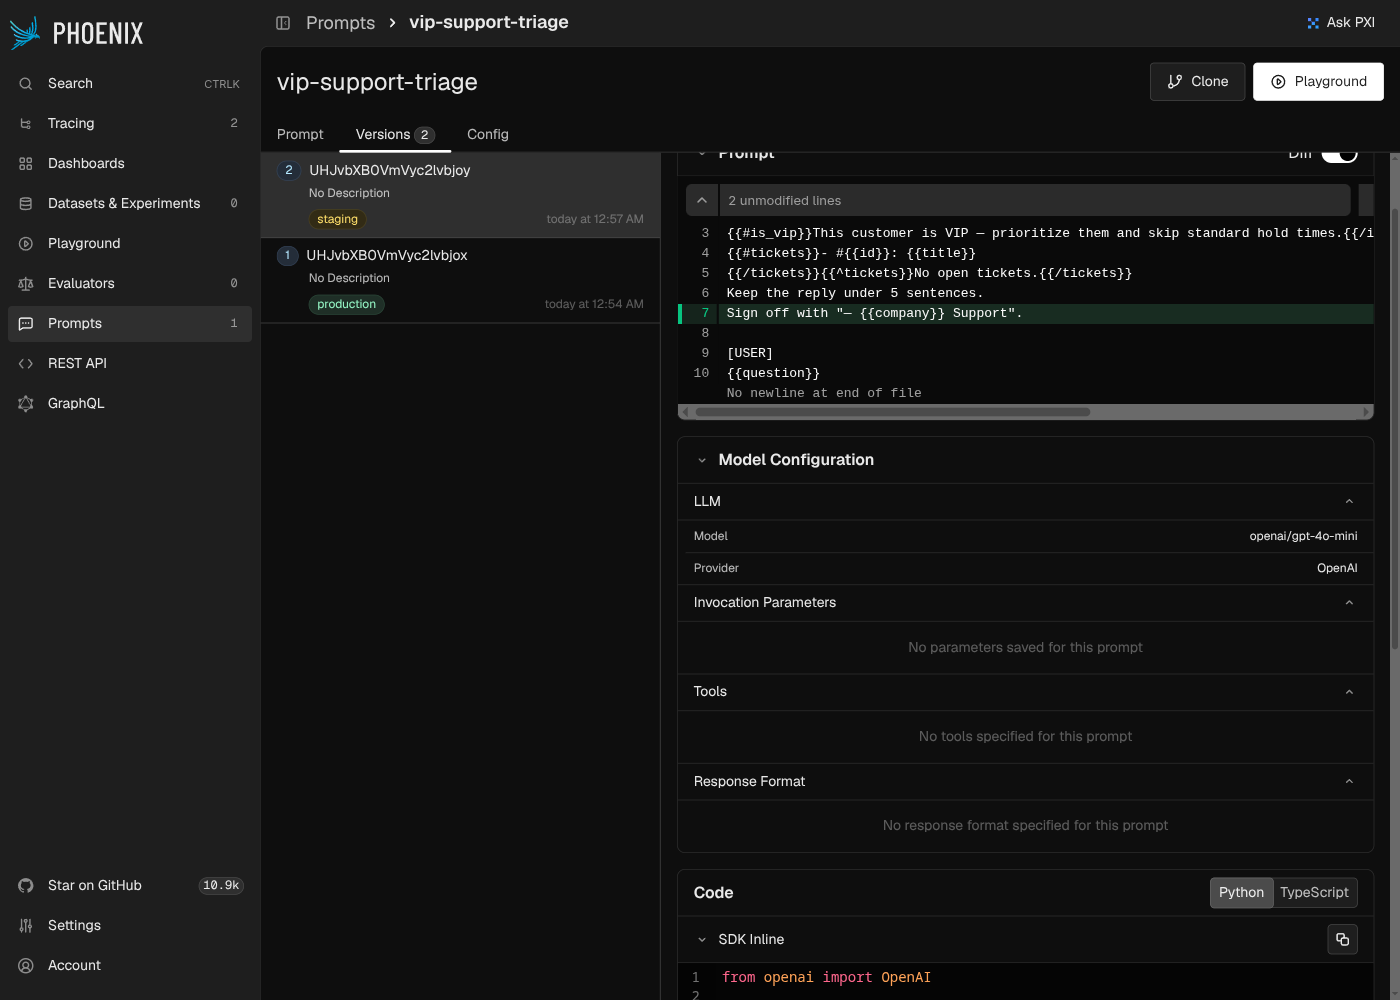
Phoenix also has a diff view between versions. Its Playground has one gap: the input fields are
flat text boxes. If you type a JSON array into the tickets field for the Mustache loop,
Phoenix does not parse it. Mustache treats the whole string as one truthy value, the loop runs
once with no bound fields, and the ticket lines render blank (- #: ) with no error. The SDK
renders the loop correctly (see SDK & DX below), because there the array is a real Python
list. So the gap is in the Playground's inputs, not in the templating engine.
| Feature | Phoenix | AcruxCore |
|---|---|---|
| Conditional templating | Mustache sections, one syntax for if and for, verified hands-on | Nunjucks {% if %}/{% for %}, rendered server-side |
| Version comparison | Diff toggle between any two versions | Diff tab, unified diff between any two versions |
| Live/staging labels | production / staging tags on a version; the client can pull a prompt by tag | production / staging aliases, resolved by prompts.render() or the gateway |
| Structured variables in Playground | Flat text input only: arrays and objects don't parse, and fail silently | Typed variable schema |
Sending a live call
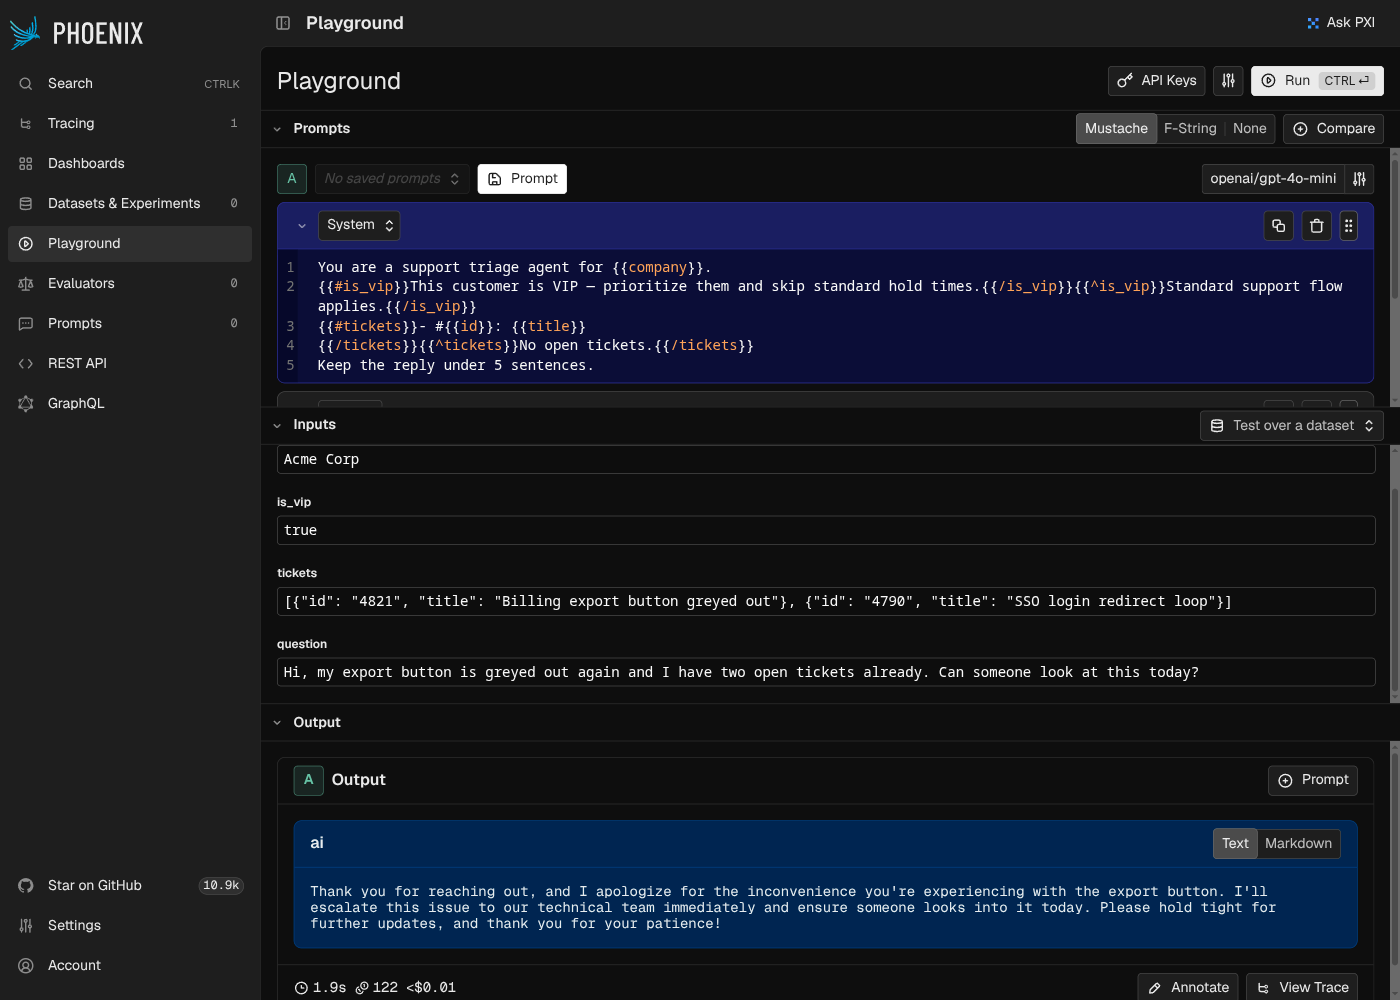
Both need a connected model before anything runs. Phoenix needed one extra setup step: OpenAI-compatible providers with a custom base URL live under Custom AI Providers, separate from the built-in OpenAI, Anthropic, Bedrock and Gemini list. We also had to switch its API Type from "Responses" to "Chat Completions" for OpenRouter to accept the request.
Show screenshot: Playground run on Phoenix
| Feature | Phoenix | AcruxCore |
|---|---|---|
| Playground | Runs against a saved prompt version, cost/tokens/latency shown inline | Runs against a stored prompt reference, shows cost/cache/latency inline |
| Custom OpenAI-compatible providers | In a separate "Custom AI Providers" section that needs the right API Type | Any OpenAI-compatible base URL |
Where Phoenix sits in a call
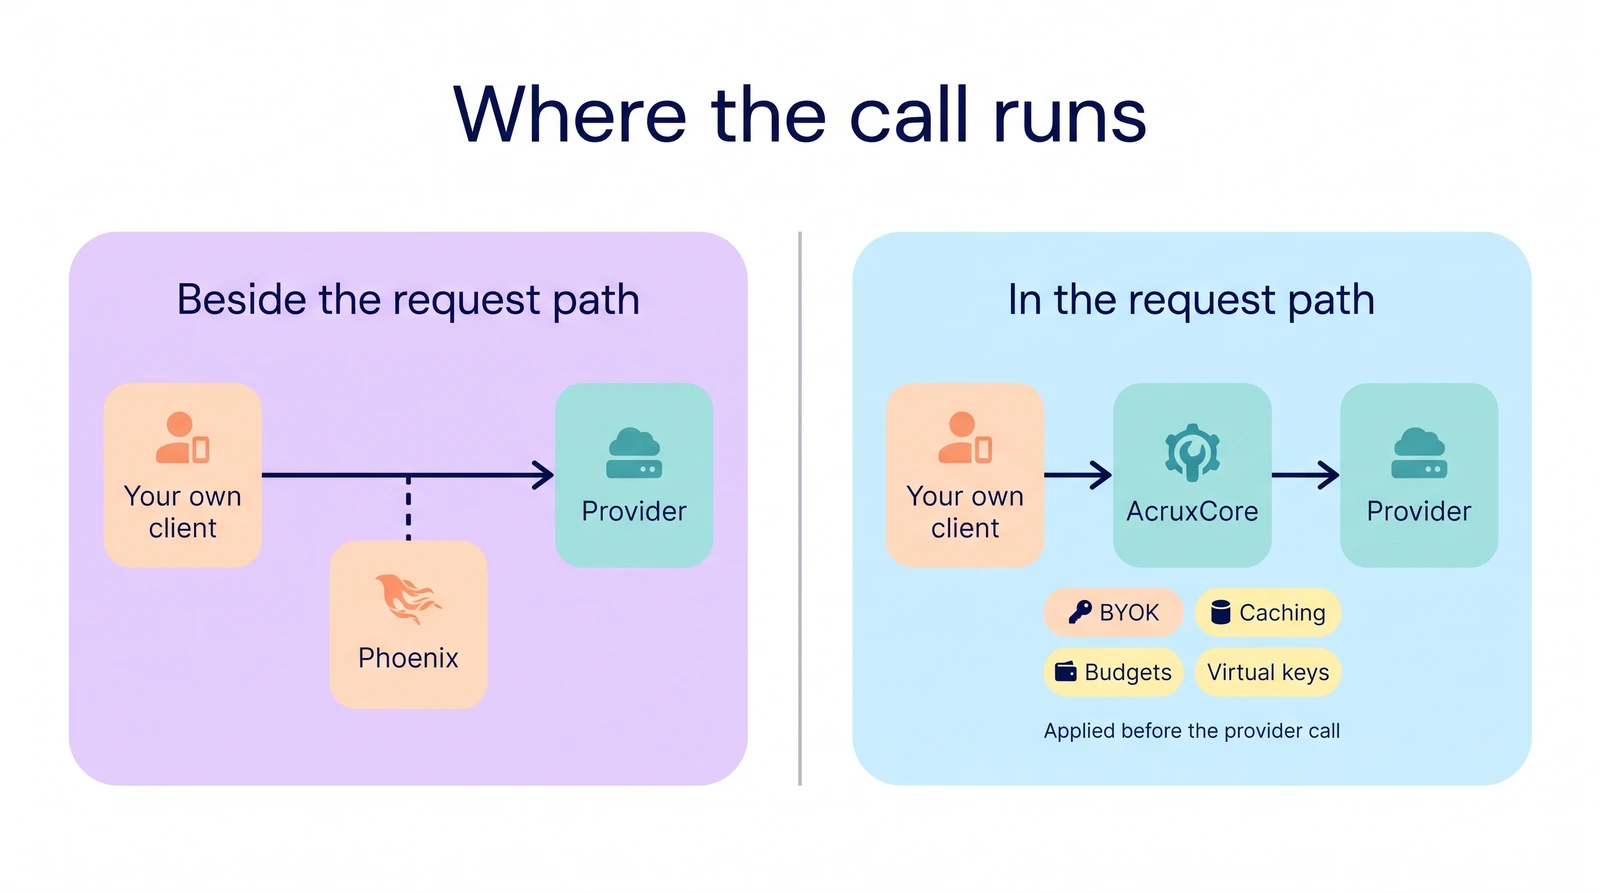
Phoenix records calls and does not route them. When we pressed Run in its Playground, the
browser did not call the provider. Network inspection showed one POST /graphql to Phoenix's
own backend, which made the provider call. That relay has no routing, caching or budget logic.
From code, the SDK path (see SDK & DX below) skips the relay and calls the provider
directly. This design works with any provider without changing your call site.
AcruxCore's gateway is in the request path, so BYOK provider selection, caching, budgets and virtual keys apply before the provider is called. The price is the extra hop, measured in Latency overhead below.
| Feature | Phoenix | AcruxCore |
|---|---|---|
| Where it sits | Beside the request path. Playground relays through GraphQL, SDK calls go direct | In the request path. Every call routes through it |
| BYOK, caching, budgets, virtual keys | No request path to apply them to | Applied before the provider call |
Tools: saved with the prompt, or kept in a catalog
AcruxCore has a Tool Catalog: callable functions, versioned like prompts, with their own analytics page. Phoenix has no nav item for tools. The closest thing is a "+ Tool" control in the Playground's message editor, which defines a JSON Schema function for that prompt. Phoenix's docs list tools as one part of a prompt, and "each time you save a prompt in Phoenix, Phoenix saves a snapshot of it as a prompt version" (checked on 2 November 2026). So a tool is versioned together with its prompt. No catalog is shared across prompts, and in our run Phoenix did not execute the tool or measure its calls.
| Feature | Phoenix | AcruxCore |
|---|---|---|
| Tool definition | JSON Schema saved with each prompt version, defined in the Playground | Versioned catalog entry, reusable across prompts |
| Execution & analytics | Not found | Executed calls, volume/error-rate/P50-P95 per tool |
Evaluation & datasets
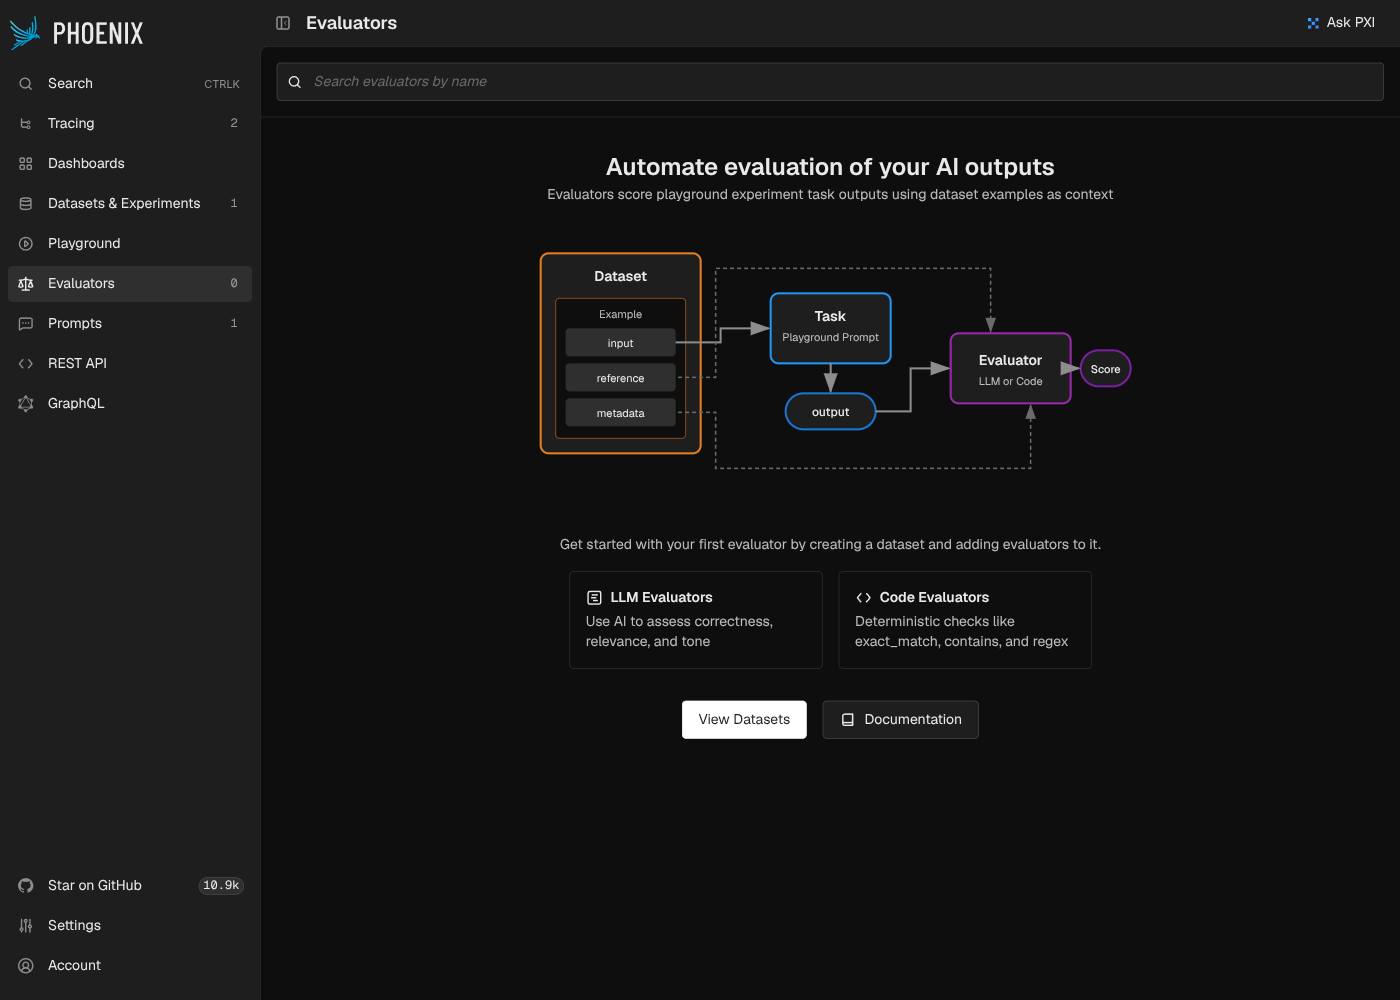
Phoenix's dataset flow starts from a trace: select a span, "Add to Dataset", name it. It is as
quick as AcruxCore's. Its Evaluators page also draws a diagram that separates LLM evaluators
(AI-judged) from Code evaluators (deterministic checks like exact_match and regex).
AcruxCore does not show that split as its own category.
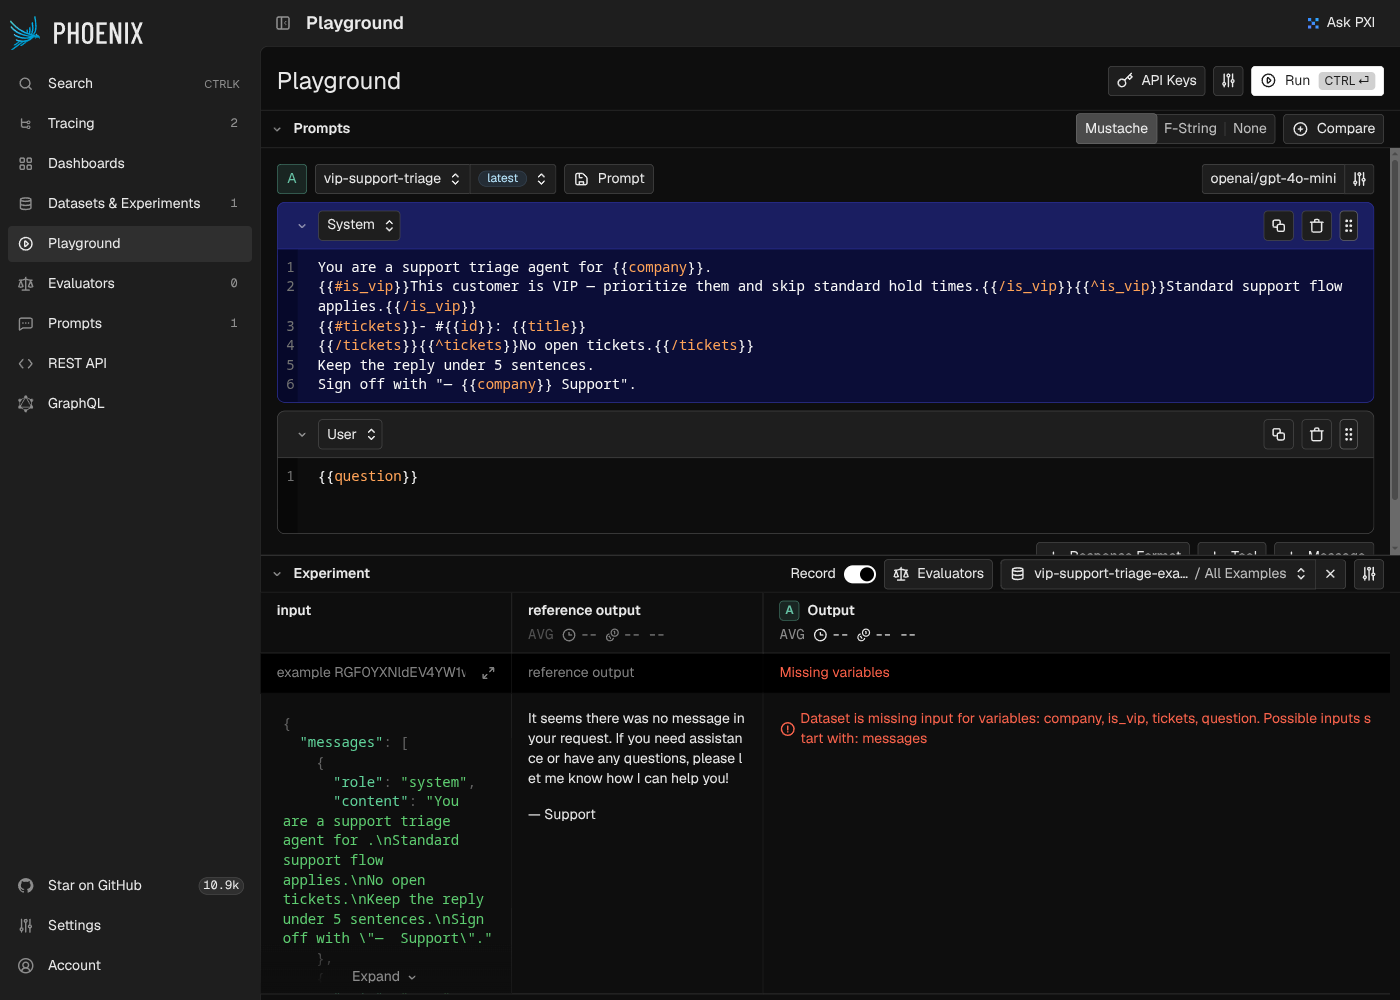
Running an experiment against that dataset failed. The dataset stored the span's rendered
messages array, not the original template variables (company, is_vip, tickets,
question). Pointing the experiment at our saved prompt produced "Dataset is missing input for
variables". The captured example and the templated prompt need manual remapping before they
fit together.
Show screenshots: evaluators overview and the failed experiment run
| Feature | Phoenix | AcruxCore |
|---|---|---|
| Dataset from a trace | Yes: select a span, add to dataset | Yes, from span-level trace feedback |
| Evaluator types | LLM evaluators and deterministic Code evaluators, shown as two paths | LLM judges on the server; code scorers in your own process through the SDK |
SDK & DX
AcruxCore's SDK renders a stored prompt on the server with hub.prompts.render(), and the
gateway writes the trace, so the caller has no tracing code. Phoenix renders on the client. Its
docs show the client pulling a prompt by name, version or tag, for example
client.prompts.get(prompt_identifier="my-prompt-name", tag="staging"), and then filling it with
prompt.format(variables=...) (checked on 2 November 2026). Our script did not use that path:
it built the system message by hand in Python, so the Phoenix leg here shows tracing, not
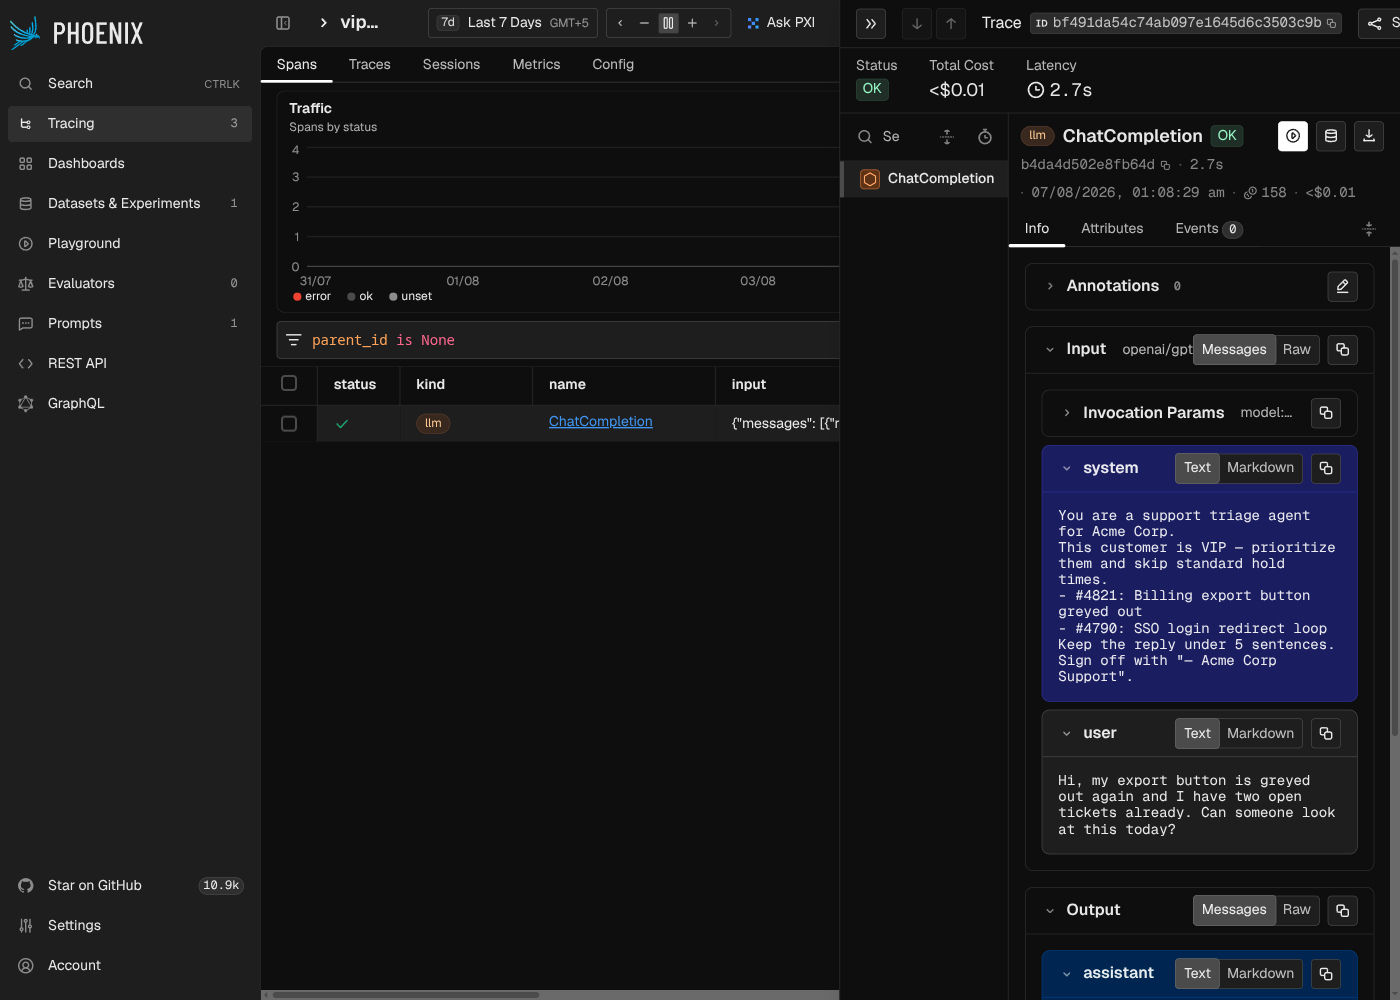
prompt fetching. Once instrumented, OpenAIInstrumentor wraps the OpenAI client and the trace
lands correctly. The ticket loop renders right here, because tickets is a real Python list.
from phoenix.otel import register
from openinference.instrumentation.openai import OpenAIInstrumentor
from openai import OpenAI

tracer_provider = register(
    endpoint="http://localhost:6006/v1/traces",
    project_name="vip-support-triage-sdk",
)
OpenAIInstrumentor().instrument(tracer_provider=tracer_provider)

client = OpenAI(api_key=OPENROUTER_KEY, base_url="https://openrouter.ai/api/v1")
# this script builds the system message by hand; Phoenix's client can also pull the prompt and call prompt.format()
px_trace_run.py— the Phoenix leg.acx_sdk_run.py— the AcruxCore leg.
Show screenshot: SDK-produced trace on Phoenix
| Feature | Phoenix | AcruxCore |
|---|---|---|
| Prompt rendering | Client-side: pull the prompt, then prompt.format(variables=...) | Server-side: hub.prompts.render() |
| Tracing | Manual instrument step (register + OpenAIInstrumentor), then automatic | Automatic with hub.gateway.chat(), no tracing code |
Latency overhead — measured
The phoenix_otel leg wraps the OpenAI client with openinference-instrumentation-openai. The
acx_gateway leg posts to the local AcruxCore gateway. Both were timed against a direct call to
gpt-4o-mini on api.openai.com, in 100 interleaved rounds per run, over three runs.
| Run | Direct-call median | Phoenix gap | AcruxCore gap |
|---|---|---|---|
| 1 | 599 ms | +21 ms, CI [+2, +44] | +51 ms, CI [+27, +72] |
| 2 | 630 ms | −14 ms, CI [−30, +5] | +11 ms, CI [−3, +24] |
| 3 | 615 ms | +8 ms, CI [−11, +30] | +38 ms, CI [+16, +58] |
- Phoenix's median gap was the lower of the two in all three runs, by 25 to 30 ms.
- Several intervals cross zero, so three runs are not enough to put a firm number on either path.
- The two are different kinds of cost: client-side instrumentation pays CPU and serialization, and an extra network hop pays for routing and caching.
AcruxCore's own figure moves between benchmarks. Our newest measurement of a local gateway on its own, on 25 October 2026, found a median of +9 ms against a direct OpenAI call, with a 95% interval of −15 to +28 ms. The method is in How much overhead does an LLM gateway add?. In our August full-cycle benchmark, which also times the prompt fetch, Phoenix's gap was 0 ms with an interval of −122 to +101 ms.
latency_bench.py — the latency benchmark.
Friction hit during this run
Setting up the Custom AI Provider was simple once we found it under Settings → AI Providers rather than the API Keys popover. Two problems cost time:
- 👎 The Playground's flat-text variable inputs mis-render structured data with no error (see Prompt authoring & versioning above).
- 👎 A dataset built from a trace can't drive an experiment against a templated prompt without remapping (see Evaluation & datasets above).
| Feature | Phoenix | AcruxCore |
|---|---|---|
| Time-to-first-trace | Requires register() + instrument() before any call | No code: the first gateway call traces itself |
| Custom provider setup | One extra field (API Type) to get right | BYOK, no extra step |
What Phoenix does that AcruxCore doesn't
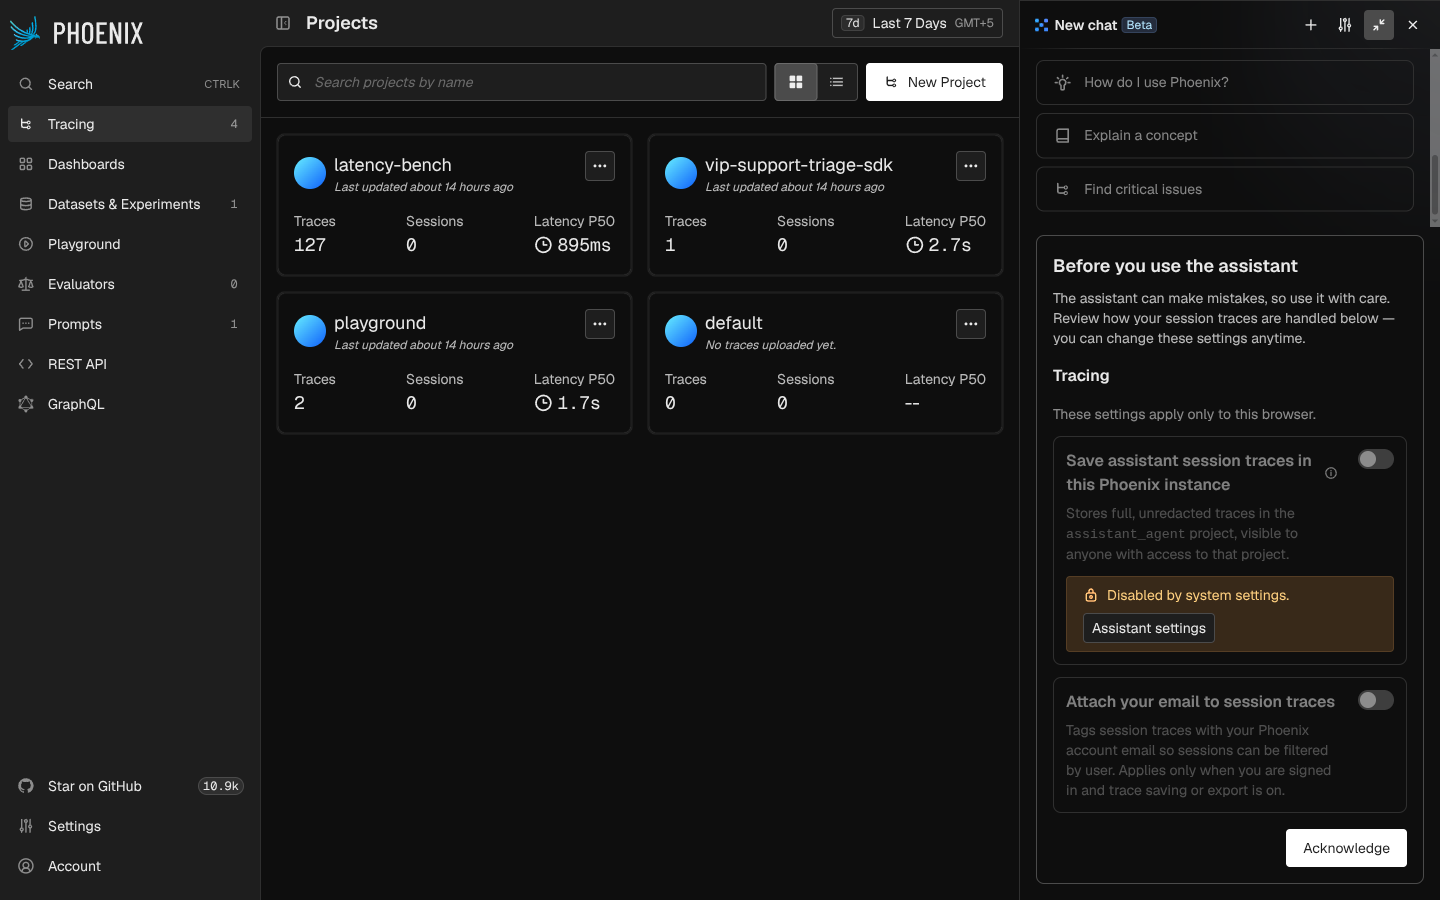
PXI, a built-in assistant docked in the dashboard. A chat panel lives on every Phoenix page, seeded with suggestions like "Find critical issues" and "Explain a concept". It can answer questions about your own traces, not only about Phoenix in general. AcruxCore has no in-dashboard assistant.
Show screenshot: PXI, Phoenix's built-in assistant
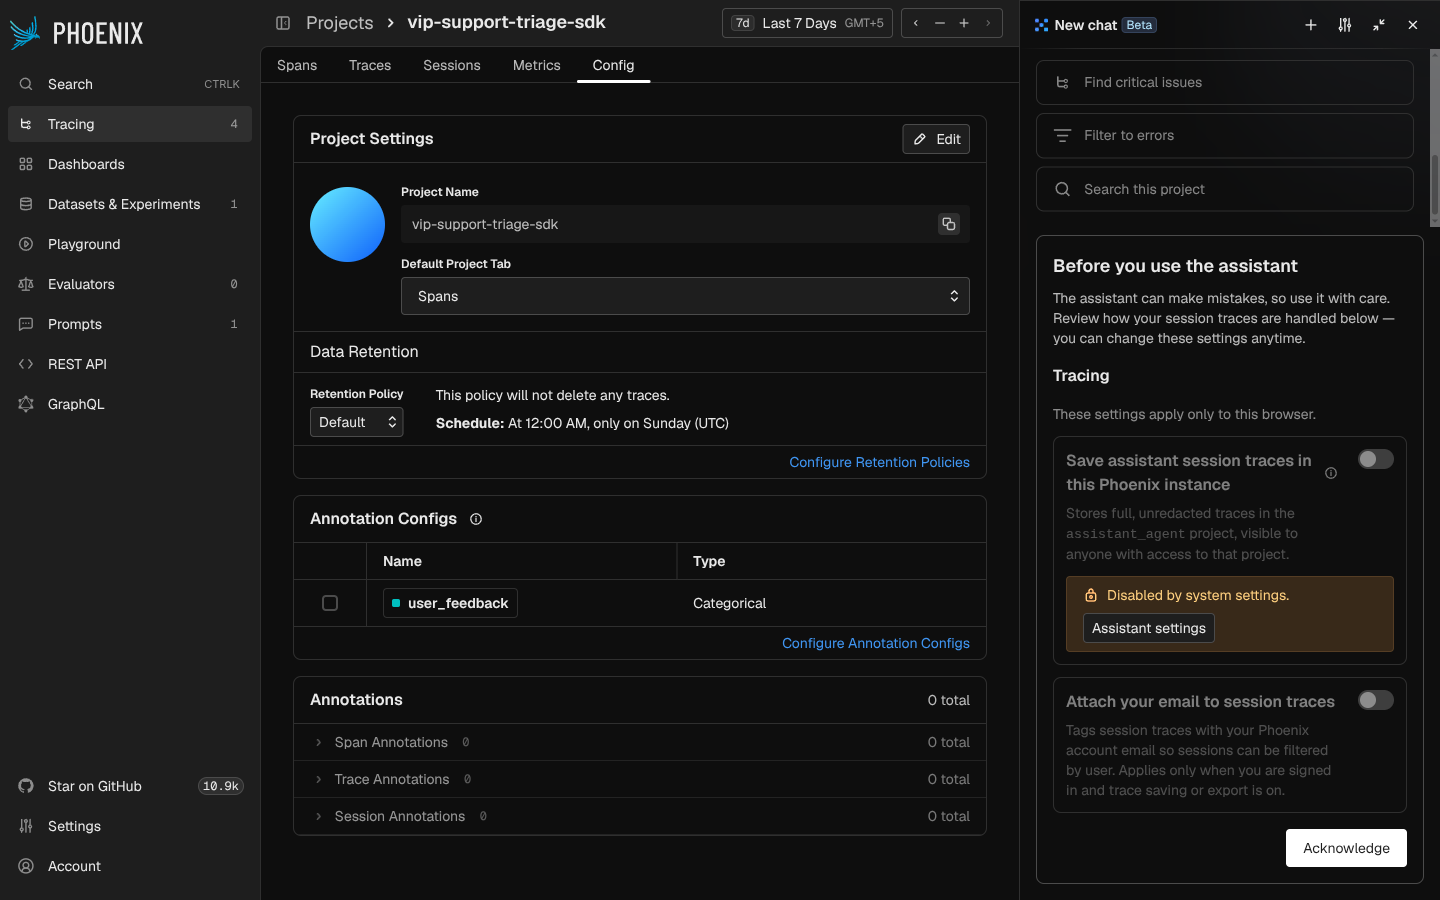
Per-project data retention on a schedule, plus typed annotation configs. Project Settings
lets you set a retention policy with a schedule (this instance's default runs "At 12:00 AM, only
on Sunday (UTC)"). You can also define named annotation types, here a Categorical
user_feedback config, instead of a single free-form rating. AcruxCore's payload capture is one
team-wide on/off switch, with no per-project retention schedule and no typed-annotation
configuration.
Show screenshot: per-project retention and annotation config on Phoenix
Is AcruxCore an Arize Phoenix alternative?
For running an LLM app, yes. For notebook-based analysis, no.
Phoenix has no request-path gateway, and it saves tools as JSON Schemas inside each prompt version without executing them. Its self-hosted install has three roles (admin, member, viewer) once you turn authentication on, and its docs describe no teams and no audit log (checked on 2 November 2026). Check that first if more than one person needs access.
Phoenix's per-span attribute depth is better than ours, and AcruxCore has nothing like PXI. If your work happens inside a notebook and OTel-native tracing is the whole job, Phoenix is the better fit.
The two also combine: AcruxCore accepts OTel-instrumented traces on an OTLP endpoint, so you can keep Phoenix's instrumentation and send the calls themselves through our gateway.
| Phoenix | AcruxCore | |
|---|---|---|
| Strongest at | Per-span trace attributes, a split between LLM and code evaluators, a built-in dashboard assistant | A request-path gateway with routing, caching and budgets on every call; tools that execute and get measured; server-side prompt rendering with no tracing code |
| Weakest at | No request-path gateway; auth off by default; no teams or audit log in its docs; flat Playground inputs mis-render structured template data | No in-dashboard assistant; no code evaluators on the server; a team audit trail with no export |
Key point: The choice turns on where the call runs. Phoenix observes a call your own client makes and renders prompts in your process. AcruxCore makes the call through its gateway, so budgets, caching and tool execution apply before the provider answers.
FAQ
Can Arize Phoenix be self-hosted?
Yes. We ran a self-hosted Phoenix at localhost:6006 for this comparison, from source published
under the Elastic License 2.0. Authentication is off by default and has to be turned on before
users get roles.
Does Phoenix have an AI gateway?
No. Phoenix sits beside the request path. Its Playground relays calls through its own GraphQL backend, and SDK calls go straight to the provider, so there is no routing, caching or budget step.
Can Phoenix render a stored prompt from code?
Yes, on the client. Phoenix's client pulls a prompt by name, version or tag and fills it with
prompt.format(variables=...). AcruxCore renders the stored prompt on the server instead.
What template syntax does Phoenix use for prompts?
Mustache, F-String, or no templating. In Mustache, one section syntax handles both conditionals
and loops, where Nunjucks uses separate {% if %} and {% for %} tags.
Does Phoenix have user roles and audit logs?
With authentication on, Phoenix has three roles: admin, member and viewer. Its docs describe no teams and no audit log.
Can I use Phoenix and AcruxCore together?
Yes. AcruxCore accepts OTel-instrumented traces on its OTLP endpoint, so Phoenix's instrumentation can stay while the provider calls go through AcruxCore's gateway.
Other head-to-heads: AcruxCore vs Opik and AcruxCore vs MLflow. For a wider field, see 10 LLM observability tools tested hands-on.