Tracing & observability
An open-source LLM observability platform that traces every call.
A call becomes a trace with spans for model, tokens, latency and cost. Route through the gateway and tracing is already on, with nothing to instrument. Keep calling providers directly and the same spans arrive over OpenTelemetry instead.
What you get
Spans, sessions, feedback and payload control.
Spans, not log lines
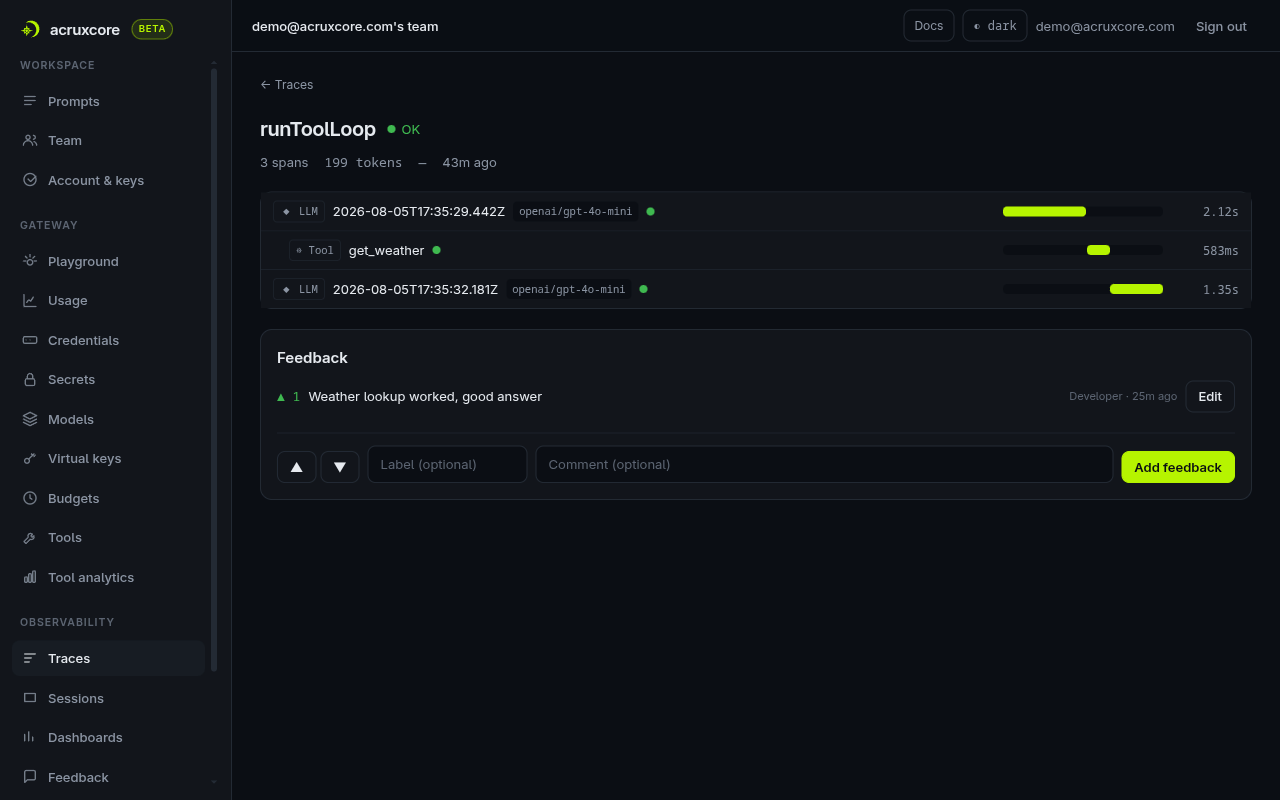
A trace is a tree. A tool-calling loop shows up as the model span, the tool span beneath it, and the follow-up model span — with tokens and cost attributed to each.
Sessions
Group related traces under a shared session id and read a whole conversation or agent run back as one rolled-up view instead of a pile of disconnected requests.
Human feedback
Attach a rating, label, or comment to a trace or to one span inside it. That feedback is what later becomes an evaluation dataset.
Payload capture you control
Metadata is always recorded. Storing full request and response bodies is a per-team switch you own, so sensitive content is only kept when you decide it should be.
Integration
Two ways to send traces.
The gateway is the shortest path to a trace, not the only one. Nothing about tracing requires you to move your model calls behind us.
Through the gateway
Every completion the gateway serves is recorded on the way through — spans, tokens, cost, latency and the prompt version behind the call. There is nothing to instrument and no exporter to run.
Over OpenTelemetry
Keep your current model-calling code and export spans to the OTLP endpoint — JSON or protobuf, gzip fine. Both SDKs ship a one-call helper: register() from @acruxcoreai/sdk/otel in Node, and from acruxcore.otel in Python (the otel extra).
Or post spans yourself
POST /traces takes a trace and its spans as plain JSON, so a language with no SDK still reports. Both clients can buffer that call off your critical path.
The OpenTelemetry path is instrumentation you set up once — an exporter, plus the framework instrumentors you name. Coverage differs by language: Python instruments crewai, langchain, llama_index, openai and openai_agents; Node instruments openai and openai_agents, with LangChain.js and LlamaIndex.TS wired by hand. Only packages already installed are instrumented.
Reading them back
Filter, group and score what you collect.
A trace list only helps if you can reach the one that went wrong. Everything you attach at call time becomes something you can search on later.
Filter on what you tagged
Narrow by model, status, cost, latency, prompt version or session — and by the tags and metadata you set on the call yourself.
Group into sessions
A session id rolls a conversation or an agent run into one view, with the cost and duration of the whole thing rather than of a single step.
Watch the aggregate
Time-series analytics over every span ingested — volume, latency, cost, error rate — so a regression shows up before someone reports it.
Payload capture decides how much of a span you can read back: metadata is always stored, full request and response bodies only while your team has capture on.
In the dashboard
Everything without writing a line of code.
The API and SDKs cover the automated path. For the day-to-day, the dashboard does the same work in the browser.
- Walk a span tree and see the input and output of each step.
- Filter traces by model, status, cost, latency, tag or metadata to find the slow tail.
- Rate a span that missed, then jump to the prompt version behind it.
- Read time-series analytics over every span the gateway or SDK ingested.
- Turn payload capture on or off for the whole team in one setting.
Go deeper
Documentation for this piece.
The rest of the platform
It composes with the other six.
Each piece works on its own, and they get better together — a trace links back to a prompt version, a dataset is built from feedback.